Create a chart
Pick a chart type and the editor opens straight away. Drafts save on this device, so you can close the tab and come back to finish later.
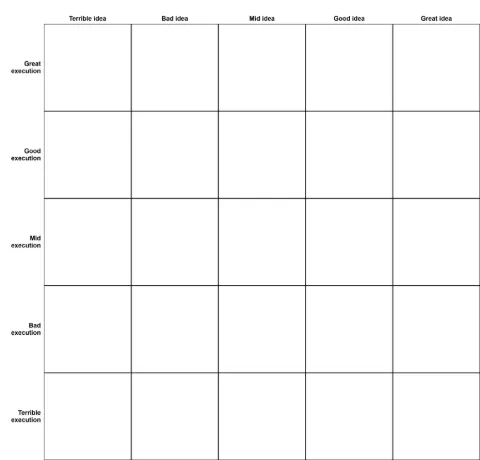
Sort things into a grid, 2x2 to 100x100.
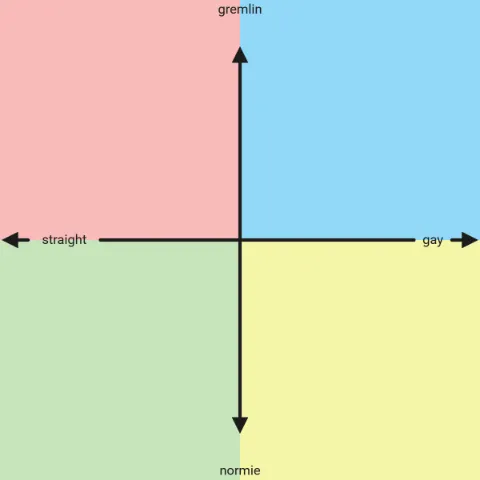
Make an alignment chartBrowse alignment chartsA blank canvas for images, text and shapes.
Make a freeform canvasBrowse freeform canvasesShow where money flows, or chart pay over time.
Make a sankey diagramBrowse sankey diagramsOpen a tier list with the items already loaded
Closed catalogs that open as your own chart: flags, presidents, parks, fruit, and name-only sports and snack boards. Rank them, add to them, or delete anything you do not want.
Open a map that is already colored
Worked examples that open in the editor as your own chart. Change anything on them, or clear the colors and start over.
Open an iceberg with the layers already stocked
Known topics that open as your own chart: conspiracies, gaming secrets, internet mysteries. Sink entries deeper, surface them, rename or delete anything.
Open a bingo card with the squares written
Word packs for the classroom, the shower, the road trip, the meeting and the watch party. Keep the squares, rewrite a few, or clear them and write your own.
Open a numbered ranking grid
Square boards with the cells already numbered and the headers left off. Fill the cells with your picks, best first.
Open a one-axis spectrum
A single horizontal axis with a label at each end: based to cringe, overrated to underrated, best to worst, or a blank pair you name yourself.
Open a starter pack meme
A bold title bar and a set of captioned image slots, laid out as ordinary freeform pieces you can move, restyle or add to.
Open an album chart grid
Topsters-style square grids on a dark canvas, with or without a numbered title list beside the covers.
Popular templates
See all templatesCharts other people set up and left open for anyone to fill in.






















Questions
Do I need an account?
Not to make one. Every editor here opens without a login, your work is kept in this browser as you go, and exporting the picture never asks you to sign in. Publishing is the one action that needs an account, because a published chart is a public page with a name on it. Work anonymously and sign in at the point you publish: the chart you were editing comes with you, and from then on your published charts are collected on one profile page and can be edited from a second device.
Is it free?
Yes. Every editor on the site is free, with no trial period and no limit on how many charts you make. The site is paid for by the ads around the page rather than by charging for the tool.
Can I download the image?
Yes. Every editor exports the finished chart as a picture, and you can do that without publishing anything. If you do publish, you also get a link with a preview image that unfurls properly in a post or a chat.
Can I edit it later?
Yes. Unfinished charts stay in this browser and are listed under My charts, and a published chart keeps a private edit link so you can change it and publish again. Clearing your browser data is the one thing that loses a draft.
What formats can I export?
PNG and JPEG for every chart type, and a PDF page for printing. A map exports SVG as well, which is vector shapes rather than pixels, and can save the data behind it as a CSV. PNG is the one almost everywhere you would want to post a chart accepts, so it is what the dialog opens on. Publishing adds the shareable page link with a preview image.